Identify critical maintenance tasks with a productivity dashboard
When you are managing multiple websites, it is important to know what maintenance tasks are most pressing. The account dashboard is a productivity dashboard that highlights those urgent tasks so you can complete them before moving on to other maintenance.
Overall sites status
As shown below, the top of the account dashboard contains graphs that summarize the overall status of the sites in your account. Using an intuitive color scheme, the pie charts show which sites are properly connected to Watchful.
It also shows the uptime status, how many sites have pending software updates, and how many sites have fresh backups.
Thus, a quick glance is all that is needed to determine how many sites might need urgent maintenance.
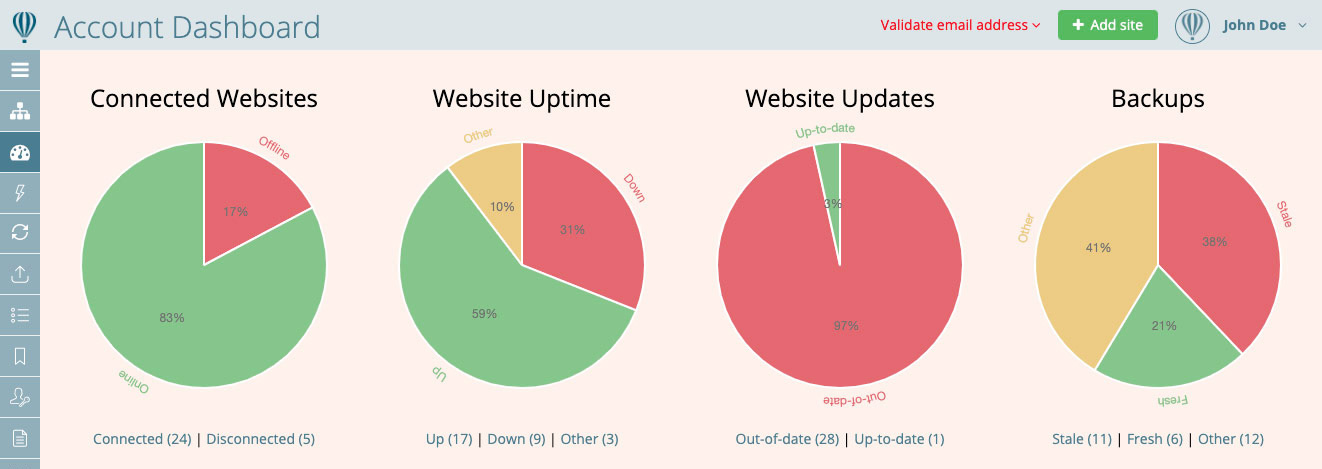
Account dashboard showing graphs of sites status.Reducing maintenance time
But this productivity dashboard does more than just show you important issues: it also helps you perform maintenance faster. Let’s see how.
Using the backups graph above as an example, it shows that 11 have stale backups. Clicking either the Stale (11) link or the red slice of the pie chart will display only those 11 sites in the sites dashboard.
Fresh backups can then be performed on the sites dashboard using our bulk tools or individually with the remote backup creator.
Identifying problematic sites and pre-filtering the relevant maintenance tool each go a long way to make website maintenance more efficient.
Updates, backups and vulnerability scans
The next section in the account dashboard lists top software updates, the software that most need updating. In other words, software titles that have pending updates on the most number of sites.
Similar to the stale backup example above, clicking on the links provided in the top software updates area will launch the bulk updater filtered for that specific updater.
This area also lists recent backups and vulnerability scans with quick links for easy access to more information on each backup/scan.

Account dashboard showing top software updates, recent backups, and recent vulnerability scans.Monitoring uptime and log errors on the productivity dashboard
The bottom of the account dashboard displays recent uptime and downtime events, as well as recent errors from the maintenance logs.
Once again, clicking the links in these provided takes you directly to the place to view more information about the issue.
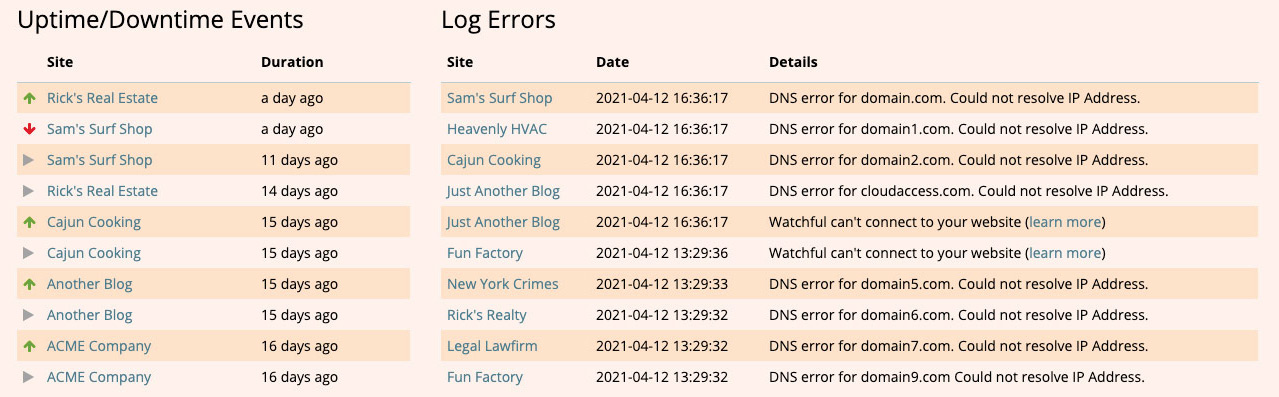
Account dashboard showing recent uptime/downtime events and recent log errors.